Introduction
Annual vaccination rates for influenza and pneumonia vary significantly across the US, with some areas having much higher rates than others. Further, a lack of public health infrastructure and barriers related to social determinants of health limit the capacity of some areas to effectively vaccinate their population. There is a need to identify areas that may have higher rates of population that are hesitant or refuse to receive COVID vaccine, as well as areas that may lack capacity for large-scale vaccine distribution.
See our Geospatial Brief for data sources and detailed discussion. Read all our Geospatial Briefs at https://healthlandscape.org/geospatial-analysis
How to Use
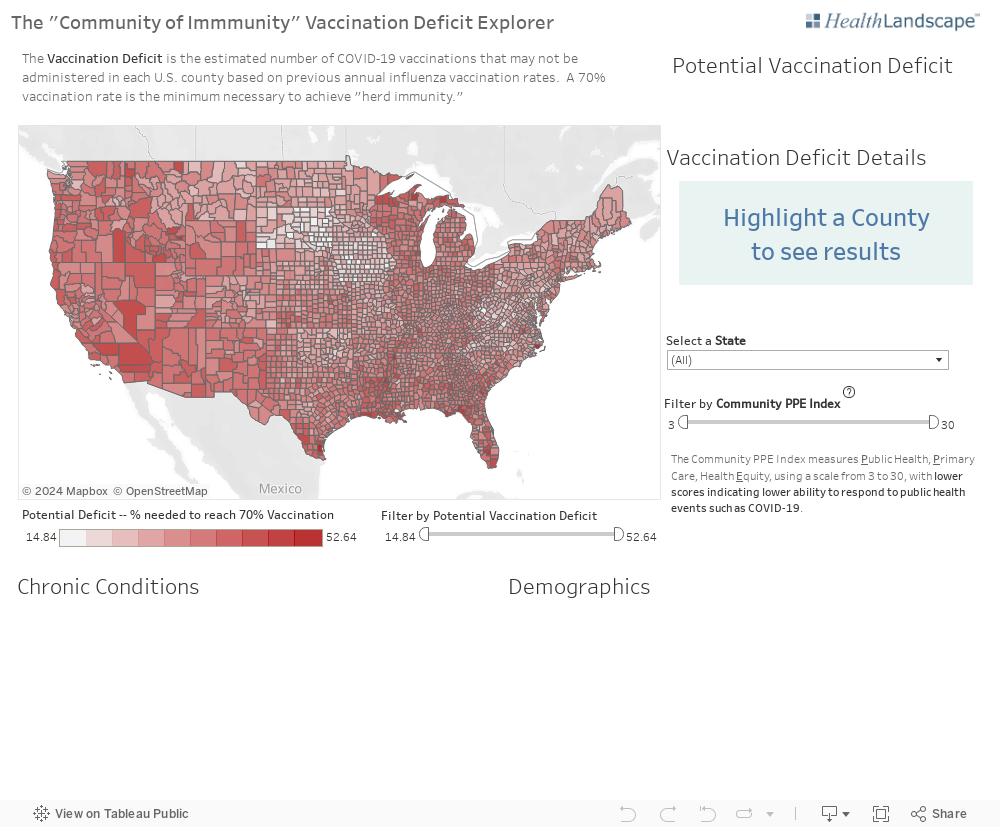
- Select State
- Adjust Filters for your state, based on the table below.
- Use the table below to identify State 75th percentile for Flu Vax Deficit (for example, AL has value of 36.3). Set the left thumb of the "Filter by Potential Vaccination Deficit" slider to match the value in the table. This will display only counties that have Vax deficit rates greater than or equal to 75th percentile.
- Use the table below to Identify State 25th percentile for PPE (for example, AL has value of 8). Set the right thumb of the "Filter by Community PPE Index" to match the value in the table. This will display only counties that have PPE Index values less than or equal to 25th percentile.
The map will display counties that are in the top 25th percentile for flu vax deficits and bottom quartile for PPE.
Select counties to see county name and explore total population, vaccine deficit numbers, chronic conditions, and demographics.
How to Interpret
The remaining counties in your selected state typically have lower influenza vaccination rates (for your state), and are less likely to have public health infrastructure to support the vaccination needs of your state.
| State Abbrev. | PPE Median | Flu Vax Deficit Median | PPE 25th %ile | Flu Vax Deficit 75th %ile |
|---|---|---|---|---|
| AL | 11 | 33.6 | 8 | 36.3 |
| AR | 11 | 32.9 | 8 | 34.5 |
| AZ | 11 | 37.2 | 7 | 37.8 |
| CA | 14 | 34.7 | 10 | 37.4 |
| CO | 20 | 30.1 | 16 | 32.8 |
| CT | 19 | 28.9 | 17.3 | 29.9 |
| DC | 15 | 35.5 | 15 | 35.5 |
| DE | 18 | 29.1 | 16 | 31.3 |
| FL | 15 | 36.1 | 9 | 39.9 |
| GA | 10 | 34.6 | 7 | 36.2 |
| HI | 17 | 39.7 | 16 | 47.1 |
| IA | 19 | 22.6 | 15 | 24 |
| ID | 14 | 37.1 | 10.3 | 39.3 |
| IL | 15 | 33.7 | 12 | 35.2 |
| IN | 16 | 32.6 | 13 | 34.1 |
| KS | 15 | 32.8 | 13 | 35 |
| KY | 10 | 31.6 | 7 | 33.1 |
| LA | 8 | 38.7 | 6 | 40.1 |
| MA | 21 | 32.7 | 15.8 | 35.1 |
| MD | 23 | 30.3 | 18 | 32.3 |
| ME | 20 | 29.5 | 15.3 | 30.7 |
| MI | 17 | 33.8 | 12 | 36.7 |
| MN | 21 | 26.9 | 17 | 29.1 |
| MO | 13 | 28.7 | 10 | 30.3 |
| MS | 8 | 33.5 | 5 | 36 |
| MT | 16 | 28 | 14 | 29.9 |
| NC | 15 | 27.3 | 10 | 29.8 |
| ND | 18 | 27.5 | 14 | 29.6 |
| NE | 18 | 28.4 | 14.5 | 30.2 |
| NH | 22 | 28.6 | 19 | 30.1 |
| NJ | 21 | 31.8 | 15 | 34.9 |
| NM | 10 | 35.2 | 8 | 36.9 |
| NV | 14 | 34.6 | 9 | 37.2 |
| NY | 16 | 31.8 | 13 | 33.8 |
| OH | 16 | 32.9 | 12 | 34.8 |
| OK | 12 | 27.2 | 8.5 | 29.4 |
| OR | 15 | 36 | 11.5 | 38.1 |
| PA | 17 | 27.3 | 14 | 28.8 |
| RI | 22 | 27.5 | 17 | 28.4 |
| SC | 11 | 32.3 | 8 | 35 |
| SD | 18 | 20 | 12 | 22.5 |
| TN | 11 | 32.9 | 8 | 34.6 |
| TX | 10 | 33.3 | 8 | 35.2 |
| UT | 15 | 33.2 | 14 | 36.7 |
| VA | 18 | 28.8 | 14 | 31.5 |
| VT | 22 | 28.2 | 18.8 | 29.8 |
| WA | 16 | 32.5 | 10 | 36.2 |
| WI | 21 | 35.9 | 17 | 37.7 |
| WV | 12 | 25.5 | 9 | 27.4 |
| WY | 18 | 35.6 | 15 | 36.3 |